How to Add a Chart
Charts give you rich reporting and analysis within the LogMeIn Central workspace. Each chart is a representation of data pulled from a specific LogMeIn Central report or Alert Package.
Who can use this feature? The full
set of LogMeIn Central reports and charts is available for the following:
| Basic/Plus/Premier Subscription | Modular Subscription | User Permissions |
|---|---|---|
|
|
|
-
In the LogMeIn Central, you can create charts in two places:
- Reports page
- Alerts page
- Click Add Chart. The Add Chart dialog box is displayed.
-
Select a
Category and
Report/Alert type.
For details, see LogMeIn Central Report Types and LogMeIn Central Alert Rule Types.
- Name the chart.
- Choose the Chart type (usually table, bar, or pie).
- Select the data to be displayed.
- Follow the on-screen instructions to complete your chart.
- Click Save. Your chart appears on the active dashboard tab.
Moving and editing charts
To move a chart, grab it by the header and drag it to the preferred
location on the tab. You cannot move a chart to another tab.
To edit a chart, click the wrench icon.
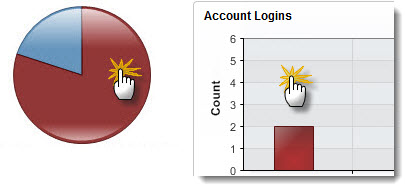
To drill-down from chart view to standard view, click
anywhere in the chart space.